Key Takeaways
- 72% of distributed companies fail to track engagement across time zones because they use office-designed metrics
- The 12 critical metrics include asynchronous collaboration patterns, response time windows, and distributed team burnout signals
- Your tech stack needs timezone-aware analytics, not traditional HRIS platforms
- Data quality requires active collection strategies specific to remote environments
- Successful implementation follows a three-stage maturity model from basic compliance to predictive analytics
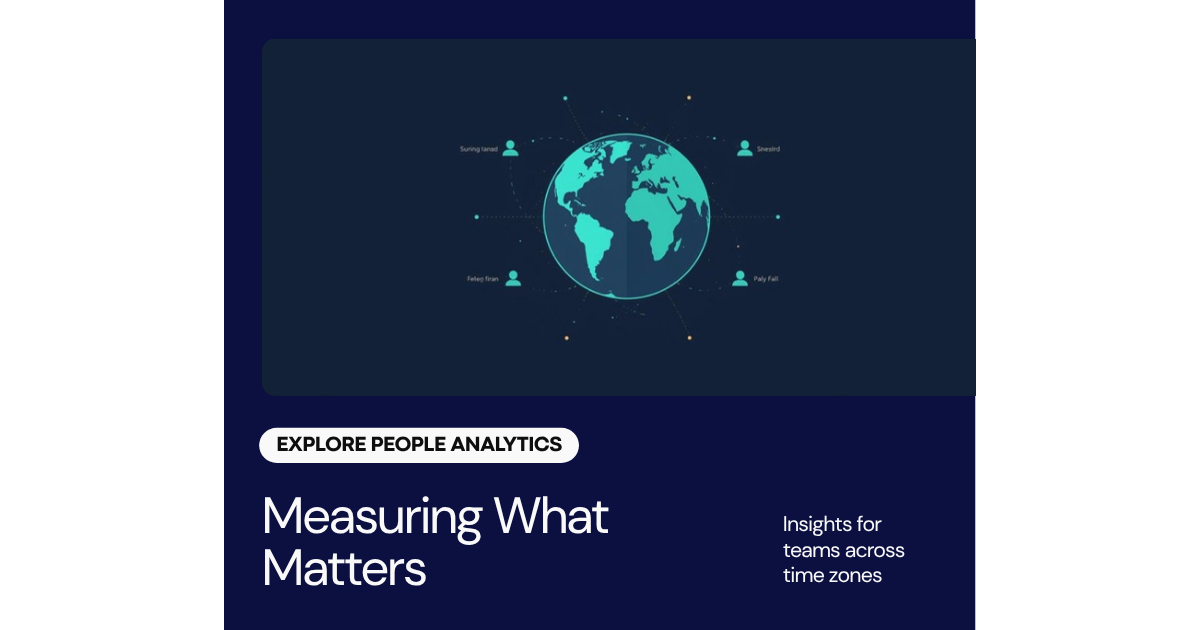
What Is People Analytics? (And Why Distributed Teams Need a Different Approach)
People analytics is the systematic collection and analysis of workforce data to make informed business decisions about talent. It transforms HR from intuition-driven to evidence-based. But here’s what most definitions miss: traditional people analytics was built for co-located teams in single time zones.
According to McKinsey’s 2025 State of Work, 79% of distributed companies collect the same metrics as their office counterparts. This is like measuring office attendance in a fully remote company. The metrics don’t match the reality.
Distributed teams require analytics that accounts for asynchronous work, overlapping time zone windows, indirect collaboration signals, and cultural cohesion across geography. When your team spans 12 time zones, traditional engagement metrics become noise.
People analytics for distributed organizations measures what actually predicts performance and retention when people aren’t in the same room.
Why Traditional HR Metrics Fail for Remote Teams
Traditional HR metrics improve for office environments. They assume synchronous presence, visible collaboration, and manager supervision. Move work remote, and these metrics break.
The Office Metrics Problem
Consider the three most common office metrics and why they fail remote:
- Utilization Rate (hours worked): In offices, this measures seat time. Distributed teams create false positives. A person logging in at 5am PT and working until 2am can show 100% utilization while burning out. It measures presence, not productivity.
- Response Time (immediate replies): Offices expect instant responses because everyone is present. Distributed teams operate asynchronously. A 4-hour response time might be excellent when someone is in a different time zone. Penalizing slow responses breaks healthy asynchronous work culture.
- Face Time as Engagement (video call attendance): Tracking meeting attendance as engagement proxy fails when cameras are off due to timezone misalignment, family situations, or genuine deep work needs. Zoom attendance is a lagging indicator, not a leading one.
Gallup’s 2024 “State of the Global Workforce” found that remote workers using traditional office metrics experience 31% higher burnout rates than those measured by outcome-based analytics. The measurement system itself damages health.
What Actually Matters Instead
Distributed teams need metrics that measure outcomes, collaboration quality, and wellbeing signals rather than activity. You need data that answers these questions instead:
- Are people shipping high-quality work on schedule?
- How effectively do people collaborate asynchronously?
- Do people have healthy overlap time with their manager and key teammates?
- Are people burning out or maintaining sustainable pace?
- Is onboarding effective when it’s fully distributed?
- Who is at risk of leaving, and can we see geographic patterns?
These questions require different data sources and different calculations than traditional HR systems provide.
The 12 People Analytics Metrics That Actually Matter for Distributed Companies
Here are the metrics that predict team health, performance, and retention for distributed organizations. These move beyond activity tracking to outcome and wellbeing measurement.
| Metric | Definition | Why It Matters for Distributed Teams |
|---|---|---|
| Asynchronous Collaboration Score | Percentage of work completed without synchronous meetings, measured by documentation, PR reviews, and async update patterns | Indicates health of async culture and reduces timezone friction |
| Timezone Overlap Hours | Average hours per week person has with manager and key teammates in shared working hours | Measures mentorship and collaboration access across zones |
| Onboarding Velocity | Days to first meaningful contribution and days to full productivity in role | Distributed onboarding is 2x longer; tracking it reveals process breakdowns |
| Knowledge Sharing Index | Frequency and quality of documented knowledge transfer (wikis, docs, recordings) | Prevents timezone-dependent information hoarding |
| Meeting Load per Timezone | Percentage of working hours in meetings by timezone band | Early warning for meeting burden disproportionately hitting certain zones |
| Project Completion Rate | Percentage of projects delivered on schedule and within scope | Measures actual output quality independent of activity signals |
| Burnout Risk Score | Composite of after-hours Slack activity, response times outside scheduled hours, vacation days taken | Distributed work erases work-life boundaries; systematic monitoring prevents invisible burnout |
| Cross-Timezone Collaboration Strength | Number and quality of productive interactions between people in non-overlapping zones | Shows whether async culture enables or hinders global collaboration |
| Manager-Direct Report Engagement | Frequency and quality of 1-on-1 interactions, adjusted for timezone constraints | Prevents timezone disparities from creating manager-report distance |
| Team Cohesion Index | Score based on survey responses about belonging, psychological safety, and connection | Distributed teams risk siloing; cohesion predicts retention |
| Voluntary Turnover Rate by Timezone | Monthly turnover percentage broken down by geographic region | Reveals if certain zones experience isolation or poor experience |
| Promotion and Growth Visibility | Percentage of growth opportunities documented and visible to distributed team members | Remote workers can feel invisible; transparent promotion criteria builds trust |
How to Calculate the Most Important One: Burnout Risk Score
Most organizations treat burnout detection as annual surveys. For distributed teams, it’s real-time data.
Burnout Risk Score = 0.3 Ã (After-Hours Activity Rate) + 0.3 Ã (Vacation Days Unused % / 100) + 0.2 Ã (Average Response Time Outside Work Hours) + 0.2 Ã (Meeting Load Above 30% of Hours)
Each component is normalized 0-10. A score above 6.5 indicates high burnout risk requiring immediate intervention.
- After-Hours Activity Rate: Percentage of messages sent, files edited, or code pushed between 10pm-6am local time, measured monthly
- Vacation Days Unused: Rolling 12-month calculation. Used only when person actually took time (not just logged out)
- Response Time Outside Hours: Average response to non-urgent messages between 10pm-6am. Extended times suggest work-life creep
- Meeting Load: Percentage of working hours in meetings that week, capped at analysis at 70%
The key advantage: this measure catches burnout 4-6 weeks before it shows up in engagement surveys or exit interviews.
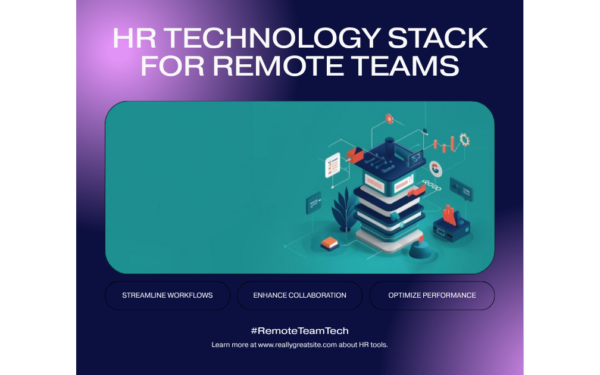
Building Your Distributed People Analytics Tech Stack
Most HR teams start with the tools they already have. This rarely works for distributed analytics. Traditional HRIS platforms like Workday or SAP SuccessFactors were designed for office workflows.
The Core Four Tools You Need
- Data Warehouse or Data Lake: Centralized repository for all workforce data (payroll, timekeeping, communications, project management, survey responses). Examples: Snowflake, BigQuery, Redshift. Cost: $500-3,000/month depending on volume.
- People Analytics Platform: Purpose-built for workforce analytics. Must support timezone calculations, async work patterns, and custom metrics. Examples: Lattice, 15Five, Personio, or custom dashboards on your warehouse. Cost: $50-150 per employee annually.
- Data Integration Layer (ETL): Tools that pull data from multiple sources (Slack, GitHub, JIRA, Google Workspace, payroll systems) and standardize it. Examples: Stitch, Fivetran, or built-in connectors. Cost: $300-2,000/month depending on data volume.
- Business Intelligence Tool: For custom reporting and visualization. Your team builds dashboards that answer specific questions. Examples: Tableau, Looker, Metabase, Power BI. Cost: $70-300 per user monthly.
Building vs. Buying
You’ll face the build-vs-buy decision. Here’s the framework:
Buy a platform if: You have under 250 employees, limited data engineering capability, or need quick implementation. Platforms sacrifice customization for speed and ease.
Build custom analytics if: You have over 500 employees, differentiated competitive advantage in people strategy, or multiple complex integrations. Custom builds require 1-2 data engineers and 3-6 month implementation but provide unlimited customization.
Most fast-growing distributed companies start with a platform (Lattice, 15Five) for first 100-200 people, then migrate to custom dashboards on a warehouse as data needs become more sophisticated.
The Essential Data Inputs
Your tech stack is only as good as the data flowing into it. For distributed analytics, you need real-time access to:
- Communications metadata (Slack/Teams: message timestamps, response times, after-hours activity, but not message content)
- Calendar data (Outlook/Google: meeting patterns, timezone overlap, no-meeting blocks)
- Project management (JIRA, Asana, Monday.com: completion rates, cycle time, scope creep)
- Time tracking (Toggl, Clockify: optional but valuable for project-based teams)
- Pulse survey data (Brief, Lattice: regular wellbeing and engagement signals)
- Payroll and HR core data (HRIS: demographics, tenure, compensation if needed for equity analysis)
Critical: Set up data governance before scale. Define data retention policies, privacy filters, access controls, and audit logging. People feel violated when personal communication data is analyzed without clear policies.
How to Collect Reliable People Data Across Time Zones
Collecting data across time zones introduces unique challenges. Your data becomes unreliable if you’re not timezone-aware about collection methodology.
The Timezone Adjustment Layer
Every timestamp in your system must be stored in UTC, then converted to local timezone only for display and calculation. This prevents double-counting of after-hours work, miscalculating response times, and distorting meeting load comparisons.
Example: A person in Sydney logs a Slack message at 9pm Sydney time. That’s 11am UTC same day, but if someone in San Francisco has their calendar set to Pacific time and pulls data without conversion, they’ll see it as a previous day’s timestamp. This breaks continuity of data.
Handling Daylight Saving Time Complications
Daylight saving time (DST) shifts happen on different dates across regions. When calculating “after-hours activity” or “timezone overlap,” you must account for these shifts dynamically.
Use libraries built for this (Moment.js, Python’s pytz, or native handling in your database) rather than manual offset calculations. Manual math breaks twice yearly.
Active Data Collection Strategies
Passive data collection (extracting metadata from Slack, Google Calendar) gets you 60% of what you need. The remaining 40% requires active collection strategies specific to distributed work:
- Weekly 2-minute pulse surveys: Ask specific questions rather than general satisfaction. “Did you have meaningful collaboration with your team this week?” beats “How happy are you?” Completion rates are 3x higher.
- Async update requests: Ask managers to submit async Friday updates on their direct reports’ health. Short form (3 bullets), asynchronous submission window (anyone can submit within a 24-hour window regardless of timezone).
- Timezone health check-ins: Monthly 1-on-1 questions specifically about timezone experience. “Do you have enough overlap time with your manager and team?” “Has your timezone negatively affected career visibility?”
- Project health surveys post-launch: After each major project, ask what worked and what didn’t for the distributed team. Collect patterns across projects.
- Manager observation forms: Lightweight templates managers complete during 1-on-1s about performance indicators they notice: communication quality, focus time, energy levels.
Privacy and Trust in Data Collection
One miscalculation here and your analytics program loses all credibility. Employees will disable Slack integrations or leave if they feel surveilled.
Set clear boundaries:
- Analyze metadata and patterns, never message content
- Report in aggregates (team level) before individual level
- Show people what data you’re collecting and why
- Get consent for any new data sources
- Maintain 6-month data retention defaults
- Allow opt-out without career penalty
From Data to Decisions: Turning Remote Workforce Analytics into Action
Metrics sitting in dashboards create no value. You need processes that turn data into decisions.
The Decision-Making Framework
Establish a monthly “People Analytics Review” meeting. This 60-minute session covers:
- KPI Dashboard Review (15 min): Highlight metric movements from last month. Only discuss outliers (metrics moving 10%+ from baseline).
- Risk Deep Dives (30 min): Pick 1-2 high-risk signals identified. Example: “3 burnout risk alerts this month, all in APAC timezone. Why?” This is hypothesis-driven investigation, not data exploration.
- Action Planning (10 min): Decide on 1-3 concrete next steps. Who owns each? When’s the follow-up review?
- Long-term Trends (5 min): Note patterns emerging over quarters. Early signals of problems ahead.
Common Decisions Your Data Supports
Hiring and Placement: If burnout risk is highest in your APAC region, don’t just hire locally. Investigate root cause. Is it timezone misalignment? Lack of management overlap? Understaffing? Your analytics reveal if the solution is hiring, restructuring, or process change.
Async Culture Investments: Asynchronous collaboration score shows you what’s working. If certain teams have high scores and low meeting load, document their practices and teach them organization-wide.
Manager Development: Manager-report engagement metrics reveal which managers are maintaining connection across timezone challenges. Pair them with struggling managers as mentors.
Onboarding Redesign: If onboarding velocity shows distributed hires take 6 months to productivity vs. 2 months in co-located roles, audit every step. Sometimes it’s documentation. Sometimes it’s lack of timezone overlap with the team. Data tells you where to focus.
Workload Rebalancing: Meeting load per timezone reveals when certain regions are meeting-heavy while others are shallow. This unbalances decision-making and marginalizes people. Rebalance meeting schedules or async decision frameworks.
Avoiding the Misuse Trap
Analytics can become a tool for control rather than support. The moment people feel metrics are used punitively, your program fails. Set norms upfront:
- Individual metrics inform conversations, not evaluations
- Team metrics inform process changes, not firing
- Outliers get support first, accountability second
- Managers and employees see their own data transparently
Common Mistakes in Distributed People Analytics (And How to Avoid Them)
Mistake 1: Copying Office Metrics to Remote
This is the most common error. You inherit metrics from your office days and try to apply them distributed. Don’t. Start from scratch with the question: “What does success look like for a distributed team member in this role?”
Mistake 2: Measuring at Individual Level Too Early
Begin with team and organization metrics. Individual metrics create anxiety and gaming behavior. Only move to individual metrics once cultural trust exists and you understand what to measure.
Mistake 3: Ignoring Timezone When You Analyze
A metric that looks fine globally might hide serious problems by region. Always slice data by timezone. A 40% meeting load for the whole company might be 20% in Americas and 60% in APAC. The average lies.
Mistake 4: Treating All Async Work the Same
Some async work is healthy (documentation, deep focus). Some is broken (people waiting 8 hours for approvals because no one is online). Measure async collaboration quality, not just frequency.
Mistake 5: Neglecting Qualitative Data
Numbers alone don’t tell the story. A 6.8 burnout risk score tells you something is wrong, but not what. Pair every quantitative signal with qualitative investigation. Have conversations with the people in the data.
Mistake 6: Building Metrics But No Implementation Process
Dashboards that sit unreviewed create no value. Assign clear ownership: Who reviews this dashboard weekly? Who decides what to do with the findings? Who follows up on action items? Without this, analytics is theater.
Mistake 7: Underestimating Data Privacy Concerns
Slack integration concerns employees. People don’t trust what they don’t understand. Over-communicate about what you’re collecting and why. Better to move slower with buy-in than fast with resentment.
People Analytics Maturity Model for Distributed Organizations
People analytics doesn’t start at full sophistication. Most organizations follow a predictable path. Understanding where you are helps you know what’s next.
Stage 1: Reactive Reporting (Months 1-6)
You’re assembling your first dashboards. Focus is on basic metrics: headcount, turnover, hiring pipeline, engagement survey scores. Most of your work is data plumbing and manual reporting.
Success metric: You have clean, accurate data flowing into a central location. Dashboards exist but are refreshed weekly or monthly.
Team size: One person (usually an HR generalist) with help from finance/analytics on the technical side.
Timeline: 3-6 months to reach baseline reporting on your 12 critical metrics.
Stage 2: Proactive Diagnostics (Months 6-18)
You move from “what happened” to “why did this happen.” You’re asking follow-up questions. High turnover in APAC? You investigate timezone factors, manager tenure, onboarding quality. Meetings high in certain teams? You diagnose async collaboration gaps.
Real-time or near-real-time dashboards replace weekly reports. You catch problems in weeks, not quarters.
Success metric: You can answer “why” questions about your data within a few days. You’re making data-informed decisions about initiatives.
Team size: 1-2 people focused on people analytics with direct support from an analytics engineer or data scientist.
Timeline: Add 6-12 months once you have clean reporting in place.
Stage 3: Predictive and Prescriptive Analytics (Months 18+)
You move from “what happened and why” to “what will happen and what should we do about it.” Predictive models tell you who’s at risk of leaving 6 months before it happens. Regression analysis shows which interventions actually reduce burnout.
This is where people analytics shifts from nice-to-have to competitive advantage. You’re not reacting anymore. You’re preventing problems.
Success metric: You predict turnover with 75%+ accuracy. You run A/B tests on people initiatives and measure impact quantitatively.
Team size: 2-4 people including at least one person with statistics background and Python/SQL skills.
Timeline: 6-12 months to develop reliable predictive models once diagnostics are stable.
Where You Should Start
If you have no people analytics function: Start with Stage 1. Get your 12 critical metrics into a dashboard over 3-6 months. Don’t try to build prediction models before you understand your baseline data.
If you have basic HRIS reporting: You’re probably at Stage 1. Upgrade by connecting more data sources (Slack, calendar, project management) to move to Stage 2.
If you have good dashboards but rarely act on them: You’re doing the work of Stage 1-2 but not the decision-making. Focus on building the process that turns findings into action before advancing to Stage 3.
Frequently Asked Questions
Never analyze message content, only metadata (timestamps, response times). Get explicit employee consent for new data sources. Maintain short data retention (6 months default). Report metrics at team level before individual level to build trust. Share what data you’re collecting, why, and how it’s used in quarterly all-hands meetings. Privacy trust breaks overnight but builds over months.
This is actionable data, not a problem. First, investigate root cause through team conversations, not assumptions. Is it understaffing? Lack of manager overlap? Time zone misalignment with key collaborators? Once you know the cause, solutions vary. Sometimes it’s hiring locally. Sometimes it’s meeting schedule adjustments. Sometimes it’s redistributing work. Let the data guide diagnosis before jumping to solution.
Start with one platform (Lattice, 15Five, or Lattice) that handles basic metrics and pulse surveys. Skip the data warehouse until you have 200+ employees. As you grow, integrate Slack metadata through platform connectors. You don’t need a data engineer until you’re running predictive models, which is rare before 300+ employees. Keep it simple early, then add sophistication as needs grow.
Monthly review meetings for decision-making, weekly dashboard monitoring for early warning signals. Don’t obsess over weekly noise. High-quality metrics show trends over weeks and months, not days. Set quarterly business reviews for strategic discussions about people strategy based on quarter-long trends. Real-time alerts are only for true emergencies (spike in burnout risk, sudden turnover).
Track cost-per-metric-implemented and compare against historical baseline. If you were losing $200K annually to turnover, and analytics-driven improvements reduce that to $120K, the $80K improvement minus your analytics cost is ROI. Better yet, calculate hiring velocity improvement, time-to-productivity acceleration, and retention gains before and after. Most mature programs show 200-400% ROI within 18 months through reduced turnover and improved hiring efficiency.
Deloitte: People Analytics Trends
HBR: People Analytics
McKinsey: People & Org Performance
Getting Started with Distributed People Analytics
If you’re ready to implement, here’s your 90-day roadmap.
Month 1: Foundation
- Define your current state. What metrics do you have? How are they calculated? Where’s the data coming from?
- Audit data quality. Is your HRIS accurate? How clean is your payroll data? Fix source data problems before building dashboards.
- Choose your core platform. Spend 2 weeks evaluating Lattice, 15Five, Personio. Implement one.
- Document a data privacy policy. What will you collect? What won’t you? How will you handle it?
- Communicate with your team. Explain what you’re measuring and why. Answer concerns. Build trust early.
Month 2: Build Baseline Metrics
- Implement your 12 critical metrics. Start with the ones requiring data you already have or can access easily (turnover by timezone, onboarding velocity, project completion rate).
- Connect your first data source. Start with HRIS or payroll. Then add calendar data if you have Outlook/Google Workspace. Then Slack if privacy policy permits.
- Create your first dashboard. Focus on clarity over completeness. 5-8 key metrics that tell a story about your distributed team health.
- Identify 2-3 people who will own ongoing reporting. Train them on the platform.
Month 3: Operationalize
- Establish your monthly People Analytics Review meeting. Invite leadership. Review metrics and decide on 1-3 next steps.
- Add your second data source. Integrate one additional platform (project management, calendar, or communication metadata).
- Document what you’ve learned in your first month. What metrics surprised you? Which require deeper investigation?
- Plan Month 4. What’s the next metric to add? What data source needs to be connected next?
Beyond 90 Days
By Month 3 you should be moving from reactive reporting to proactive diagnostics. You’re asking why questions. You’re investigating patterns. You’re making decisions based on data.
Read more about HR strategy for distributed companies to align your analytics program with broader organizational goals.
Continue Learning About People Operations
- What Is People Operations and Why Every Remote Company Needs It
- Building Remote Work Culture: The Complete Framework for Distributed Teams
- HR Technology Stack for Remote Teams: Tools, Integration, and Best Practices
- The 8 Best HRIS Platforms for Remote Companies (2026 Comparison)
- Workforce Management for Distributed Teams: Complete 2026 Guide