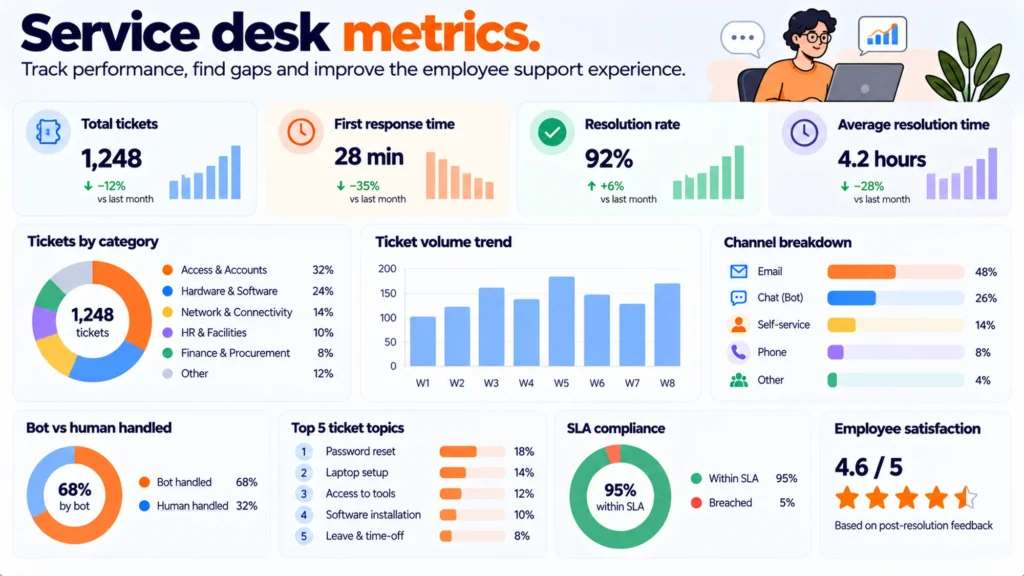
Most service desk dashboards report volume and speed. Neither tells you what to fix. A ticket count rises when things go wrong and also when people finally trust you, and an average response time mixes a four-second lookup with a three-day hardware failure. Four other numbers change decisions.
TL;DR
- Ticket volume and average response time are the two most reported metrics and the two least actionable, because both move for opposite reasons.
- Repeat contact rate tells you whether answers are landing. People rarely report a bad answer, they rephrase and try again.
- Unanswered rate is the only metric that names its own fix: every entry is a runbook somebody already needed.
- Ticket type concentration tells you where automation is worth building, and it is usually steeper than anybody expects.
- Time to first useful action beats time to first response, because an acknowledgement is not help.
- Measure in bands rather than averages. One number hiding two populations is how a desk looks healthy while failing a third of contacts.
Why volume and response time mislead
Ticket volume is the number every report opens with and it has no direction. It rises when a change breaks something, and it rises when a new starter cohort arrives, and it rises when people stop working around IT and start asking. A falling volume can mean the estate got more reliable or that people gave up.
Average response time is worse, because it is one number describing two different populations. A desk handling password resets alongside hardware replacements has a bimodal distribution, and the mean sits in a gap where almost no real ticket lives. Report the median and the ninetieth percentile separately and the same data suddenly says something.
Both numbers also reward the wrong behaviour. A target on response time produces fast acknowledgements, which is a measurable improvement that nobody experiences as help. A target on volume reduction produces a desk that is harder to reach.
Repeat contact rate
How often somebody comes back about the same thing within a few days. This is the closest available proxy for whether your answers work, and it matters more once an automated agent answers first, because the failure mode changes.
People almost never mark an answer as unhelpful. They assume they asked badly, rephrase, and try again. So a rising repeat rate on one topic is the fingerprint of an answer that has quietly started being wrong, and it appears days before anybody complains.
Track it two ways. Within a single session, which catches an answer that missed. And across days with the same requester and the same category, which catches a fix that did not hold. The second is the one that finds a recurring hardware fault being closed repeatedly as resolved.
Unanswered rate
The share of questions your knowledge base or automated agent could not answer. This is the most actionable number any service desk has, because each entry in the log is not a metric at all. It is a specific question somebody needed answered, in their own words, that nothing you have written covers.
Track the rate rather than the count, because a quiet week otherwise reads as an improvement. And sort the log into three piles rather than treating it as one list: a documentation gap where the answer exists somewhere and is not written down, a vocabulary gap where the content exists under a term nobody uses, and a genuinely missing process. The first two are a morning of work each. The third is a decision somebody has to make.
| Metric | What it tells you | What to do with it |
| Ticket volume | Almost nothing on its own | Use as a denominator only |
| Average response time | A gap where no real ticket sits | Replace with median and 90th percentile |
| Repeat contact rate | Whether answers are landing | Investigate the top topic monthly |
| Unanswered rate | Exactly which runbooks to write | Sort into three piles, fix two |
| Type concentration | Where automation pays | Automate the top three only |
| Time to first useful action | Whether anybody was actually helped | Measure in bands by request type |
Ticket type concentration
What share of contacts the top five request types account for. Nearly every desk under a few hundred seats finds this steeper than expected: password and account access, software access requests, device problems, connectivity, and how-do-I questions usually cover the large majority of everything.
The reason to measure it is that automation effort should follow concentration rather than enthusiasm. Building self-service for a type representing two per cent of contacts is a month spent on a rounding error, and it happens because that type was annoying rather than frequent.
Group by what the person was trying to do rather than by the category your tool assigned. Tool categories split one intent across three labels and merge two different ones, so the concentration looks flatter than it is and the case for automating anything looks weaker.
Time to first useful action
Not first response. First point at which something happened that the requester would describe as progress: an answer, a reset completed, a replacement ordered, an engineer booked. An acknowledgement within four minutes and a useful action on day three is a good response time and a bad experience.
What to do:
- Define useful action per request type, in one line each, and write the definitions down before measuring anything.
- Report the median and the ninetieth percentile, never the mean, and report them per type rather than across the desk.
- Set bands rather than targets: same session, same day, same week, longer. Count how many land in each.
- Exclude anything an automated agent resolved end to end, and report that separately, or it flatters every other number.
- Review the longest ten each month and ask what was actually waiting. It is usually an approval rather than an engineer.
That last point tends to be the finding. When somebody measures what the slowest tickets were waiting on, the answer is frequently a person who had to approve something and did not know they were in the path at all.
What changes once a bot answers first
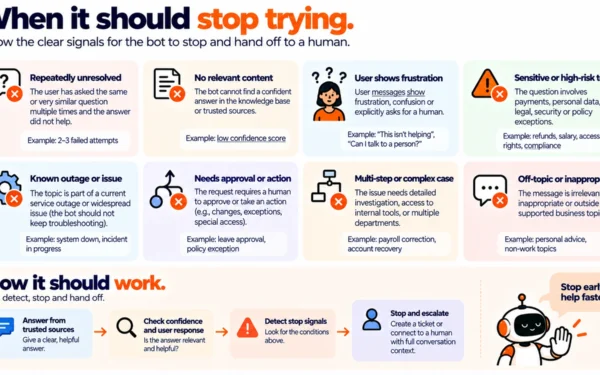
An automated agent in front of the desk breaks the metrics that assumed a human picked up. Volume falls because the answerable contacts never become tickets, which makes the remaining queue look slower and more complex, because it is. First response time collapses to seconds and stops meaning anything.
So split every report into contacts the agent resolved, contacts it escalated, and contacts that arrived straight at a person. Those are three populations with different economics and averaging them produces a number describing none of them.
Disclosure: Matram is owned by the same people who publish PeopleOpsHQ. It is relevant to this topic because its strict mode declines rather than guessing, which turns the unanswered rate into a real log rather than a silence, and it is priced flat at $29, $69 and $199 a month with unlimited seats so the asking population is not metered. It has no free tier, it answers questions rather than actioning tickets, and it is not an ITSM platform, so the escalation count stays meaningful only if something behind it owns the request. The options are compared in our IT support chatbot comparison.
Final thoughts
The two metrics on every service desk dashboard are there because they are easy to collect, not because anybody acts on them. Volume has no direction and an average response time describes a gap between two populations.
Replace them with four that name their own next step. Repeat contact rate says whether answers work. Unanswered rate says which runbook to write. Type concentration says where automation pays. Time to first useful action says whether anybody was helped. All four are available from data you already hold, and none of them needs a new tool to start reporting next month.
Frequently asked questions
Which service desk metrics actually matter?
Repeat contact rate, unanswered rate, ticket type concentration and time to first useful action. Each one names its own next step, which is what separates them from ticket volume and average response time: volume rises both when things break and when people finally trust the desk, and an average response time across a bimodal distribution lands in a gap where almost no real ticket sits.
Why is average response time misleading?
Because it is one number describing two populations. A desk handling password resets alongside hardware replacements has a distribution with two humps and a mean in the middle of neither, so the figure describes no real ticket. Report the median and the ninetieth percentile separately, per request type, and the same underlying data starts supporting decisions rather than reassurance.
What is repeat contact rate and how do you track it?
How often somebody comes back about the same thing, tracked both within a single session and across days for the same requester and category. It matters because almost nobody marks an answer as unhelpful; they assume they phrased it badly, rephrase and try again, so a rising repeat rate on one topic appears days before any complaint and is the clearest signal that an answer has started being wrong.
How should you use the unanswered question log?
Sort it into three piles rather than treating it as one list: a documentation gap where the answer exists and is not written down, a vocabulary gap where content exists under a term nobody uses, and a genuinely missing process. The first two are roughly a morning of work each and the third is a decision somebody needs to make, which makes the log the most directly actionable thing a service desk produces.
Should you measure first response or first useful action?
First useful action, defined per request type and written down before you measure anything. An acknowledgement inside four minutes followed by real progress on day three scores well on response time and badly on experience, and a target on response time reliably produces fast acknowledgements rather than faster help. Report it in bands such as same session, same day and same week rather than as a single target.
How do the metrics change when an AI agent answers first?
Volume falls because answerable contacts never become tickets, which makes the surviving queue look slower and more complex since it genuinely is, and first response time collapses to seconds and stops carrying information. Split every report into three populations: contacts the agent resolved end to end, contacts it escalated, and contacts that arrived directly at a person, because averaging them produces a number that describes none of the three.