TL;DR
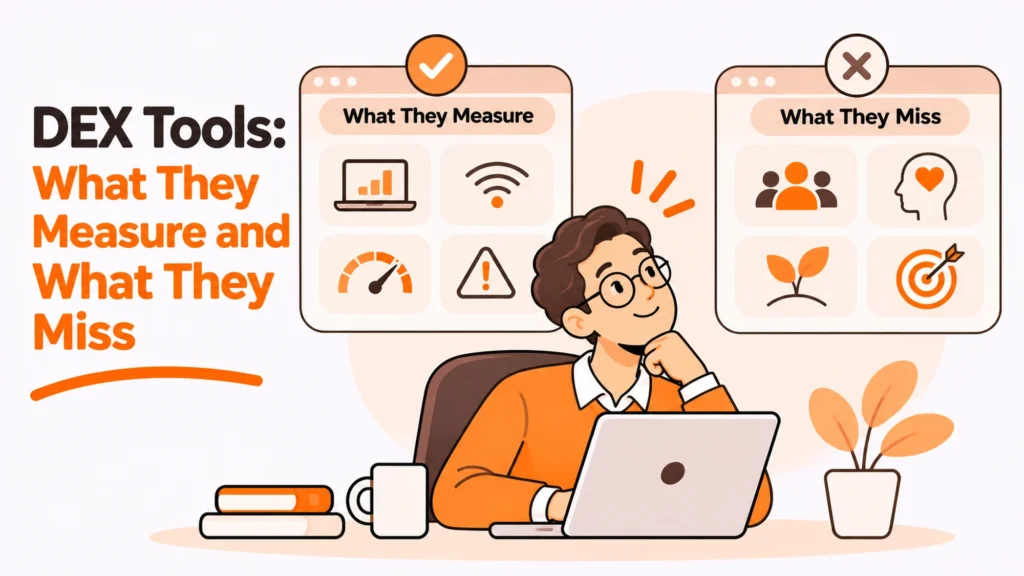
Digital employee experience tools read telemetry from the endpoint, which makes them genuinely good at a narrow band of problems and blind to two large ones. Knowing which side of that line your actual complaints sit on decides whether this is a good purchase or an expensive dashboard.
- They see the endpoint, so they are strong on crashes, boot time and resource starvation.
- Blind spot one: anything before the device exists. Shipping, setup, day one.
- Blind spot two: anything off the endpoint. A slow vendor portal looks fine.
- Score inflation is real. Composite health scores hide the one broken thing.
- Agent overhead is a cost, and on old machines it is measurable.
- Buy it to find causes, not to produce a number for a slide.
What digital employee experience tools genuinely measure
An agent on the machine reports what the machine is doing. That is a real and useful dataset, and it answers a specific class of question well.
| Question | Answered well? |
|---|---|
| Which machines crash, and on what | Yes |
| Boot and login duration | Yes |
| Memory or disk starvation | Yes |
| Battery health across the fleet | Yes |
| Which application is consuming the machine | Yes |
| Whether patches actually applied | Yes |
Those six are worth having. The battery and resource rows in particular answer the refresh question with evidence rather than with age, which is a genuine improvement on replacing everything at three years because that is the policy.
The use that actually repays the licence
Finding the small set of machines generating a disproportionate share of tickets. Every fleet has them, they are rarely the oldest, and without telemetry they are invisible because each individual complaint looks like an isolated event.
The reason they stay hidden without telemetry is that nobody triages by machine. Tickets are triaged by person and by symptom, so eight separate complaints from one laptop look like eight unrelated events spread across three months, and no amount of reading the queue reveals the pattern.
Fix or replace those and the support queue changes shape. That alone is usually the business case, and it is a smaller claim than the one on the website.
The two things they never see
Both are large, both are where most real complaints come from, and neither appears anywhere in the dashboard.
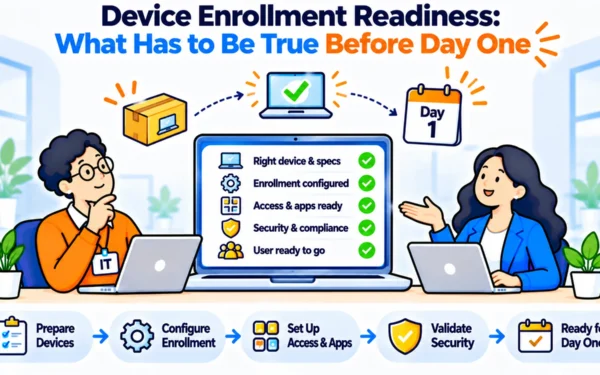
Everything before the device exists. The agent starts reporting when the machine is running. It has nothing to say about the three weeks waiting for delivery, the build that was wrong, or the new starter who had no laptop on Monday. Those are the worst experiences the company produces and the tool is structurally unable to see them.
Everything that is not on the endpoint. A slow supplier portal, an overloaded internal service, a queue where requests wait on a human. The machine is healthy throughout. The person is stuck throughout.
Why this matters when you compare it against your ticket list
Take the last hundred tickets and sort them into endpoint and not-endpoint. If most are access requests, waits for approval, supplier problems or hardware that had not arrived, a tool reading endpoint telemetry will report a healthy fleet while those continue.
That is not a criticism of the category. It is a scoping question, and it is the one most likely to be skipped in a demo, because the dashboard is genuinely impressive about the half it covers.
The hardware delivery half in particular stays a logistics problem. Configured device procurement and delivery addresses it, and the honest limitation is the mirror image of the tool’s: a logistics supplier knows nothing about how the machine behaves once it arrives.
Composite scores hide the thing you needed
Disclosure: RemoAsset, named below, is owned by the same people who publish PeopleOpsHQ. It is described with its limitations stated, on the same terms as every other supplier. This site takes no vendor money.
Nearly every tool in this category produces a single health score per device or per team. It is the number that ends up on a slide and it is the least useful output available.
A score of 82 could be a fleet where everything is slightly imperfect, or one where ninety per cent is excellent and ten per cent is unusable. Those need completely different responses and the composite cannot distinguish them.
Ask for the distribution instead. The worst decile is where the tickets come from, and it is the only part of the fleet worth acting on first.
There is a second reason to distrust the composite. The weighting behind it is the vendor’s, not yours, so two products scoring the same fleet will disagree, and neither weighting reflects what your particular users actually complain about. A number you cannot decompose is a number you cannot argue with, and it will eventually be quoted back at you in a meeting as though it meant something precise.
The three numbers to put on the slide instead
- How many machines are in the worst decile, and the main cause for each.
- How many were fixed since last month, with what action.
- How many moved into that decile, which tells you whether the fleet is degrading faster than you are repairing it.
What the agent costs
Worth asking, and rarely volunteered: the telemetry agent consumes memory and processor on every machine it monitors. On a current machine this is immaterial. On the older ones, which are precisely the machines generating your complaints, it is measurable.
Ask for the figure in megabytes and in processor percentage under normal load, and treat a refusal to give one as the answer. Every vendor has measured this; whether they will say it out loud varies.
Run the pilot on your oldest hardware rather than on a set of new laptops. If the agent noticeably degrades the machines it is supposed to be diagnosing, that is worth knowing before a fleet-wide rollout rather than after.
Deployment and enrolment state is the broader discipline here, and the UK National Cyber Security Centre device security guidance frames the managed state of a device as the control rather than its physical location, which is the right lens for deciding what the agent should be allowed to do.
The decision table
| Situation | Scale | Setup | Primary pain | Recommended starting point |
|---|---|---|---|---|
| Tickets dominated by crashes and slowness | 200 plus | Mixed fleet age | Cannot find the bad machines | Strong fit, pilot on oldest hardware |
| Tickets dominated by access and waits | Any | Any | Wrong category | Fix the queues, not the endpoints |
| Hardware arriving late | Any | Remote hiring | Invisible to telemetry | Logistics, not a DEX tool |
| Under 100 machines | Small | One platform | Licence vs benefit | Use what the MDM already reports |
| Asked for a single score | Any | Board reporting | Hides the worst decile | Report the distribution instead |
Five questions for the demo
All five are answerable on the call, and the answers sort the category quickly.
What does the agent cost in memory and processor? A specific figure, not negligible.
What do you collect that identifies an individual, and can it be turned off? This decides whether the tool is deployable in several jurisdictions at all.
Show me the distribution, not the score. If the product cannot display the worst decile easily, it was built for reporting rather than for fixing.
What happens on a machine that is offline for three weeks? Travelling and seasonal staff break naive implementations in ways that look like faults.
What of this does our existing management platform already report? Frequently more than expected, and the honest answer narrows the purchase considerably.
The question behind the questions
What the data is for. Collecting detailed per-device, per-user telemetry creates personal data with obligations attached under frameworks such as the consolidated text of the General Data Protection Regulation, and the UK Information Commissioner guidance on monitoring workers expects monitoring to be necessary for a stated purpose rather than gathered because an agent can gather it.
Aggregate fleet health is straightforward. Per-person activity detail is a different proposition and should be switched off unless somebody can say precisely why it is on. For the related question of what activity data cannot show at all, see our piece on proactive IT support.
See the half no endpoint tool can measure at configured device procurement and delivery, or read what proactive IT support actually costs.
Frequently asked questions
What do DEX tools measure well?
Anything the endpoint can report. Which machines crash and on what, boot and login duration, memory and disk starvation, battery health across the fleet, which application is consuming the machine, and whether patches actually applied. The battery and resource data in particular lets you decide refreshes on evidence rather than on age.
What can they never see?
Two large things. Everything before the device exists, because the agent only reports once the machine is running, so three weeks of shipping delay and a new starter with no laptop are invisible. And everything off the endpoint: a slow supplier portal or a queue waiting on a human, where the machine is healthy and the person is stuck.
How do I know if it fits our problem?
Take the last hundred tickets and sort them into endpoint and not-endpoint. If most are access requests, approval waits, supplier problems or hardware that had not arrived, a tool reading endpoint telemetry will report a healthy fleet while all of that continues. The demo will still be impressive, because it covers the other half well.
Why is a single health score a problem?
Because 82 could mean a fleet where everything is slightly imperfect, or one where ninety per cent is excellent and ten per cent is unusable. Those need completely different responses and the composite cannot tell them apart. Ask for the distribution, because the worst decile is where the tickets come from.
What should go on the slide instead?
Three numbers. How many machines sit in the worst decile and the main cause for each, how many were fixed since last month and by what action, and how many newly dropped into that decile. The third is the one that tells you whether the fleet is degrading faster than you are repairing it.
Does the agent itself cost anything?
Yes, in memory and processor on every machine it monitors, and it is rarely volunteered. Immaterial on current hardware and measurable on older machines, which are exactly the ones generating your complaints. Run the pilot on your oldest laptops rather than on new ones, or you will not find out until rollout.
What should be switched off by default?
Per-person activity detail. Aggregate fleet health is straightforward, but detailed per-device and per-user telemetry creates personal data with obligations attached, and published guidance expects monitoring to be necessary for a stated purpose rather than collected because the agent is capable of collecting it.
PeopleOpsHQ covers the operational side of distributed work. We describe suppliers with their limitations stated, and we take no vendor money.